
The Myth
Australians are continually being told we are all paying too much in superannuation fees, particularly when compared to overseas pension systems.
Unfortunately, quite often these broad-sweeping claims overlook substantial differences between systems that can lead to a different cost structure or more importantly they don’t take into account the performance outcomes of a system. How much does paying an extra 0.25% in fees matter if your fund is earning you an extra 1% in annual returns?
A good case in point is the Federal Government’s Your Future, Your Super discussion paper which,
The Productivity Commission found that fees in Australia are high by international standards, in part reflecting the absence of member-driven competition: “notwithstanding large differences in pension systems across countries, especially in asset allocation and administration, the costs incurred by Australian superannuation funds are some of the highest in the OECD.”
But if you were to keep reading the paragraph in the Productivity Commission’s Superannuation: Assessing Efficiency and Competitiveness Report from which the discussion paper quotes, you would also learn that:
“Notwithstanding large differences in pension systems across countries, especially in asset allocation and administration, the costs incurred by Australian superannuation funds are some of the highest in the OECD . The OECD has argued that Australia’s relatively high investment and administration fees reflect the high prevalence of SMSFs and defined contribution (as opposed to defined benefit) plans, as well as a relatively large number of smaller funds with higher average costs. The Reserve Bank of Australia made similar contentions in its submission to the Murray inquiry, adding that Australia’s compulsory system resulted in a greater degree of member disengagement than there would otherwise be — which detracted from competitive pressure on providers to contain costs and margins.”
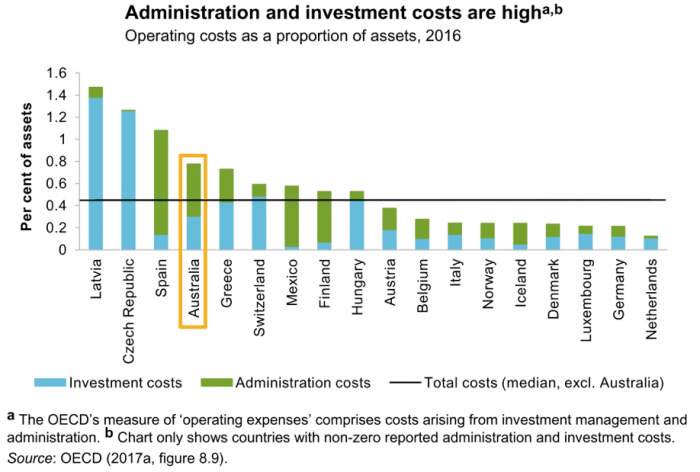
It’s immediately clear from the chart on which the claim relies that high administration costs are a major driver of Australia’s “higher fees”. Yet, as explained in our first instalment of Debunking Super Myths, the government’s reforms explicitly exclude administrative fees from the proposed benchmarking and online comparison tool.
Secondly, the prevalence of self-managed superannuation funds is cited by the OECD as a contributing factor. Once again, these are fully excluded from the scope of the government’s reforms.
Direct comparisons are problematic
Despite its resources and expertise, even the OECD has had difficulty collating meaningful comparisons of fees and costs across multiple countries. It is noticeable that Australia’s costs of 0.8% is lower than the estimates of around 1% that we usually hear ($30 billion fees on assets of $3 trillion). This is because the figures exclude what’s referred to as indirect costs – costs deducted from investments themselves as opposed to costs paid directly by each fund.
This omission could partly explain why benchmarking reported on the Federation of the Dutch Pension Funds website suggests total costs as a proportion of assets of around 0.62% in 2016, significantly higher than the 0.1% shown for Netherlands in the chart above.
Direct comparisons can have difficulty accounting for maturity and scale in a system. The average Dutch worker has contributions of 22.5% of earnings going into their account, this means that in 2016 the Dutch pension system had approximately €140,000 under management for every member. This compared to $48,000 for the average account in APRA regulated funds at the same time. If Dutch balances were at a similar level, then assuming a consistent cost structure, the total costs as a proportion of assets for the system would have been around 0.93%. Indeed one of the main reasons fees in percentage terms are expected to go down in Australia over the coming decade is because of the extra scale that will be generated from compulsory contributions rising to 12% (Australia currently has the fifth lowest level of compulsory contributions in the OECD).
At the same time, most Dutch occupational pension plans are defined benefits schemes. This means an individual’s retirement income is typically based on a formula rather than the investment returns that the fund earns. In this situation fees don’t impact retirement incomes in the same way, indeed they typically aren’t really charged at all. But while a member may not pay fees, if their defined benefit fund achieves higher than expected returns it won’t use them to further boost their income in retirement.
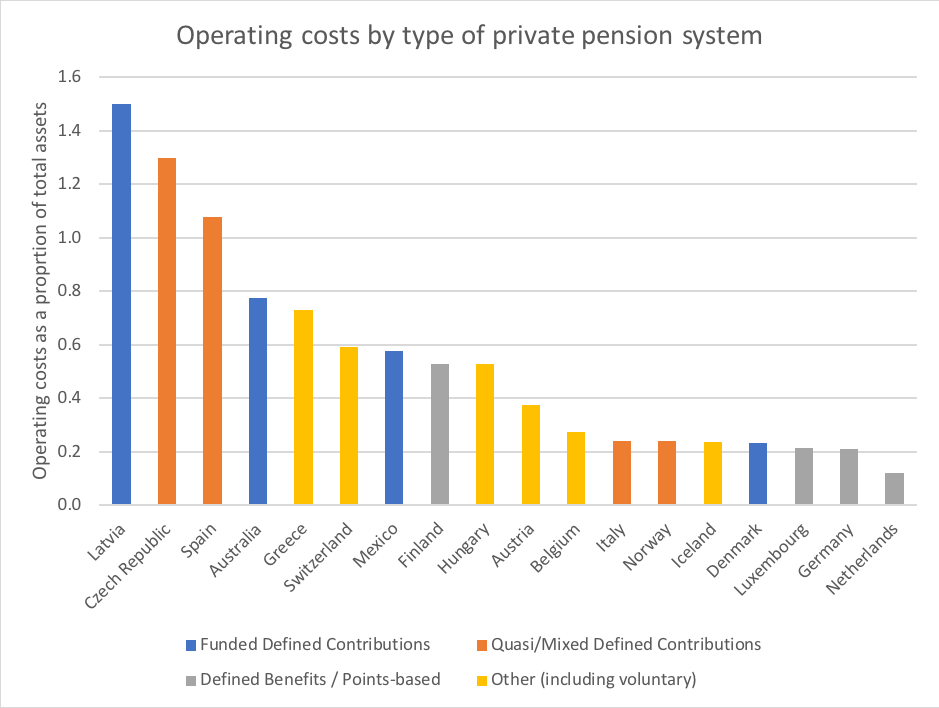
If we adjust the OECD’s chart to account for how it classifies each system, we can see that at least half of the funds with lower costs than Australia’s are defined benefits or mixed schemes – this can make comparisons challenging and sometimes even meaningless.
Retail competition or non-compulsory contributions won’t make a difference
If we are interested in testing the Reserve Bank’s suggestion that Australia’s compulsory system detracts from member engagement and therefore competitive pressure to keep down fees, we only need to look across the Tasman. Under New Zealand’s KiwiSaver scheme, contributions are not compulsory and New Zealanders can opt-out from the default contributions.
There are further aspects of the KiwiSaver system that are similar to the policy direction that the Government is seeking to take Australia’s superannuation system:
- The industrial relations system is not involved in selecting a fund for individuals that don’t choose their own. Instead New Zealanders that don’t choose their own fund are auto-enrolled in one of nine funds selected by government tender (one of the options considered by the Productivity Commission).
- It relies on an independent online comparison tool, KiwiSaver Fund finder funded by the New Zealand Government to help people choose the right fund for them, similar to what was announced in the Budget reform package.
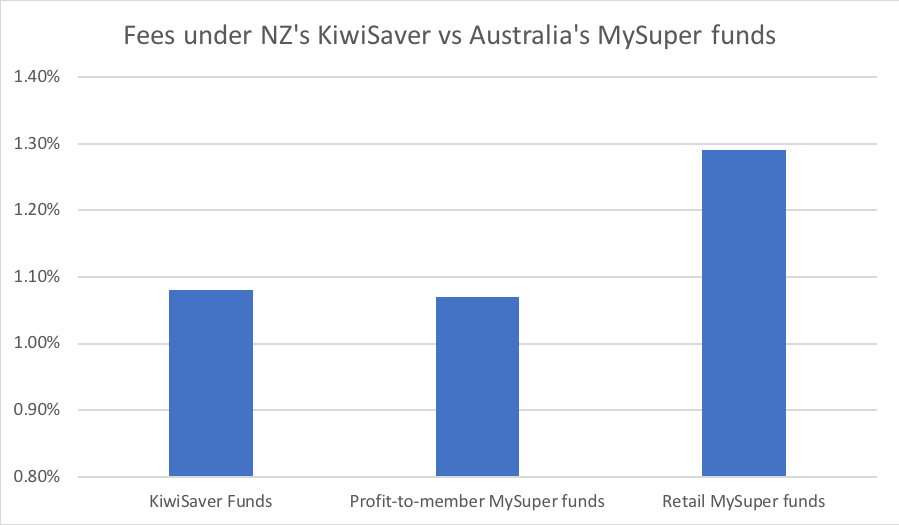
According to the KiwiSaver Fund finder the average fees across all 263 funds was 1.08%. This is broadly comparable to the 1.07% charged by profit-to-member funds for the MySuper products and materially lower than the 1.29% charged by retail funds (as measured by Rainmaker).
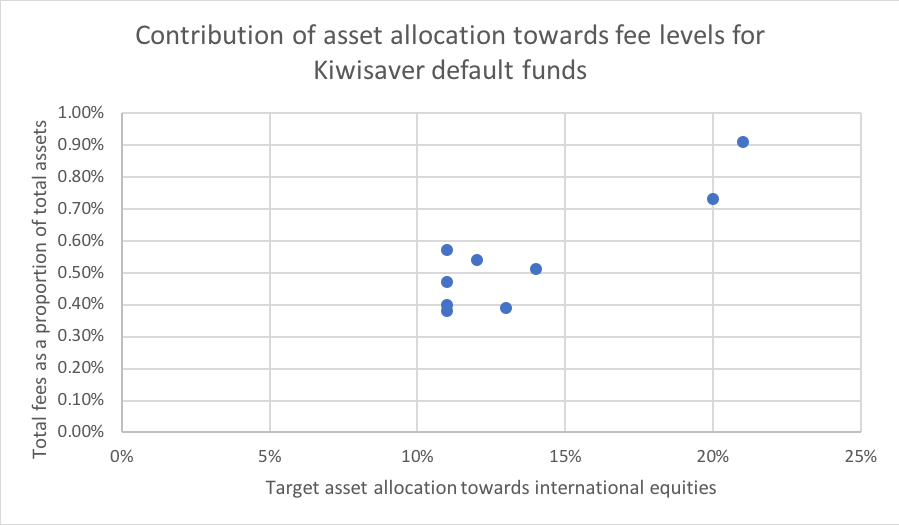
As for the nine default funds under KiwiSaver, they have average fees of 0.58% of assets under management. While this is substantially lower than the average MySuper product, the difference is largely explicable by the underpinning asset allocation. All of these default funds are for conservative investment options encompassing assets that generally attract lower investment fees.
Eight of the nine default funds targeted between 77.5% and 80% of their portfolios at cash equivalents or fixed income assets, and the single fund with a materially lower mix of 67.5% also had the highest fees at 0.91%. The funds with the highest fees also had the highest allocation of international equities in their portfolio.
As would be expected, such conservative asset allocations have a material impact on returns. According to the NZ Financial Market Authority’s KiwiTracker, in the five years to June 2020 the annualised returns after fees but before taxes for these nine funds averaged 4.84%, with the top performer returning 5.33%. To make it comparable to Australian 5-yearly returns published by APRA, we adjust for taxes using the Australian tax rate of 15% instead of NZ’s higher tax rate of 28%, which implies average net returns of approximately 4.16%. By comparison Australia’s 59 MySuper products (excluding lifecycle options) delivered average net returns of 5.62% per annum after fees and taxes. The highest returning NZ default fund only managed to exceed the net returns of just four of the 59 MySuper products, which together accounted for just 0.2% of MySuper funds under management.
To their credit, the New Zealand Government has recognised that the current settings are not delivering for the 380,000 New Zealanders that are in default funds without having made an active choice. In order to achieve better outcomes going forward it has announced a revised tender model that will consolidate the number of default funds down to five as well as shift the investment strategy from conservative to balanced. Based on the average net returns of all balanced KiwiSaver funds, this could have delivered additional annual earnings of 1.24% over the last five years for default fund members.
NZ’s experience highlights two important lessons for Australia:
- Increased reliance on individual choice or a voluntary system doesn’t seem to generate a more engaged consumer that can drive down fees or encourage better performance. It still leaves more than 12.5% of KiwiSaver members experiencing returns that are lower than 99.8% of funds in the MySuper system.
- When government’s get policy design wrong, negative ramifications can take a long time to be revealed but the consequences can be significant and irreversible.
This raises two important questions:
Firstly, If Australia’s default arrangements are delivering better returns than New Zealand’s, what aspect of those arrangements is responsible for those outcomes? And consequently, how can we be certain that the parts of KiwiSaver we are looking to imitate won’t undermine those strengths?
Secondly, and on a more practical level, if the Government can’t pull together credible comparisons and analysis to help guide legislators assess the merits of these reforms, what hope do consumers have of choosing the right fund that really suits their needs?

SOCIAL SHARE